| Version 4 (modified by , 17 years ago) (diff) |
|---|
Bolt Tutorial, Part III: Analytics
Micro-experiments
Suppose you have two alternative lessons for a given concept. Which is better? Or is each better for an identifiable subset of students? To investigate, create a micro-experiment in which students are randomly shown one lesson or the other, and then perform the same exercise.
The random selection of lesson is accomplished using a new Bolt control structure, select:
function my_rand($student, $unit) {
    return rand();
}

select(
    name('Conifer/deciduous alternative'),
    valuator('my_rand'),
    lesson(
        filename('conifer_decid.php')
    ),
    lesson(
        filename('conifer_decid2.php')
    )
)
The select takes a 'valuator' function (in this case, random) and a set of units. It shows the unit for which the valuator function has the largest value.
To see this in action, create a new course with short name "conifer3". The course document is here. Note that the select is followed by an exercise set.
Lesson comparison
After a number of students have passed through the micro-experiment, you may have enough data to conclude something about your lessons. To see how this works, go to the course Control Panel and click Lesson Compare.
You will be asked to choose a select unit and an exercise_set unit (in this case there are only one of each).
Next you will be asked about "data snaphots". A data snapshot is a "snapshot" of the contents of your course's database, for the units you have selected, over some time interval.
Initially, you will see "insufficient data". For purposes of demonstration, let's run a script that generates synthetic data. Edit ~/projects/test/html/ops/bolt_datagen.php and set
$clear_course_data = false;
$generate_compare_data = true;
$generate_map_data = false;
Then run the script:
cd ~/projects/test/html/ops
php bolt_datagen.php
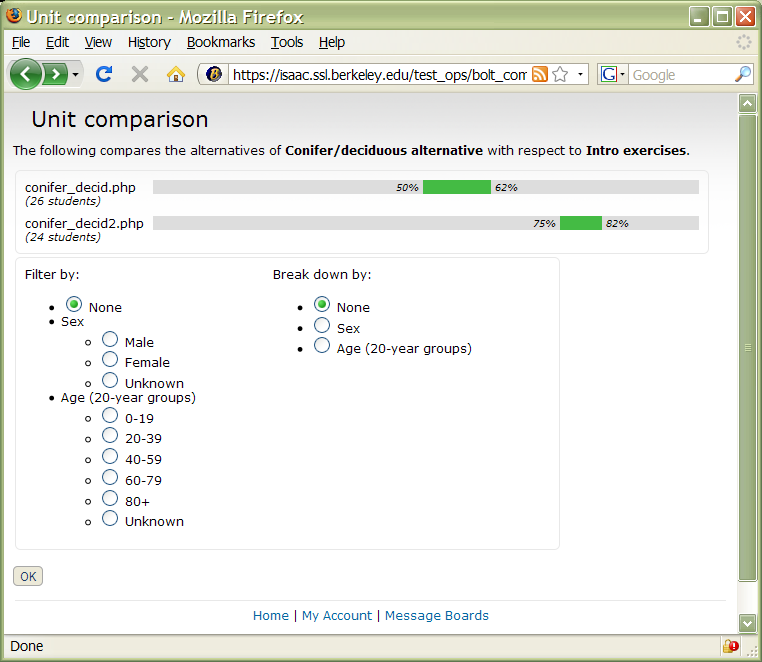
Go back and generate a new data snapshot. Now the lesson comparison will look like this:
picture
The graphs show, for each alternative lesson, the 90% confidence interval for the mean of the exercise score after that lesson was selected. If (as is the case here) one interval is entirely higher than another, it means that lesson was more effective.
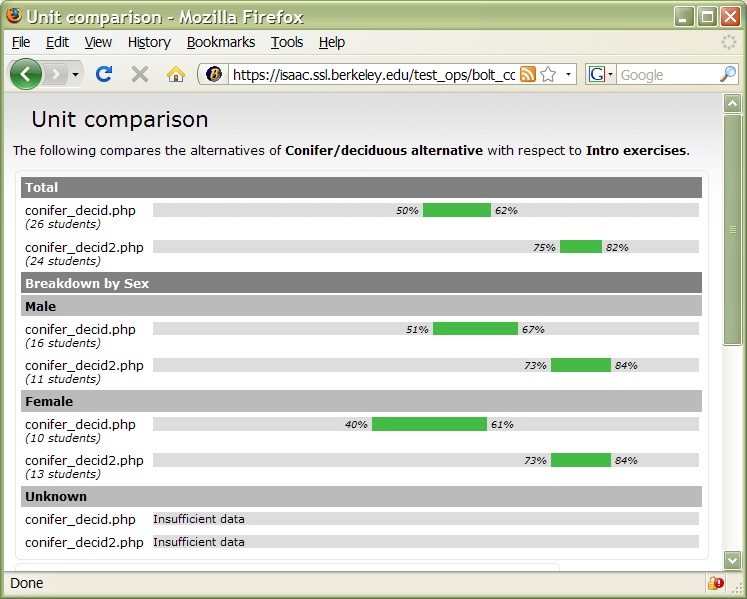
Now suppose you want to investigate the effect of student gender - e.g., whether the lessons have different effectiveness for males and females. Under "Break down by", select Sex, and click OK. You'll now see a comparison broken down by sex:
picture
In addition to breaking down the results by sex or age, you can also filter the results, i.e. to show only results for a particular subset of students. For example, if you select "Female" under "Filter by", and "Age" under "Break down by", you will see the results for female students, broken down by age.
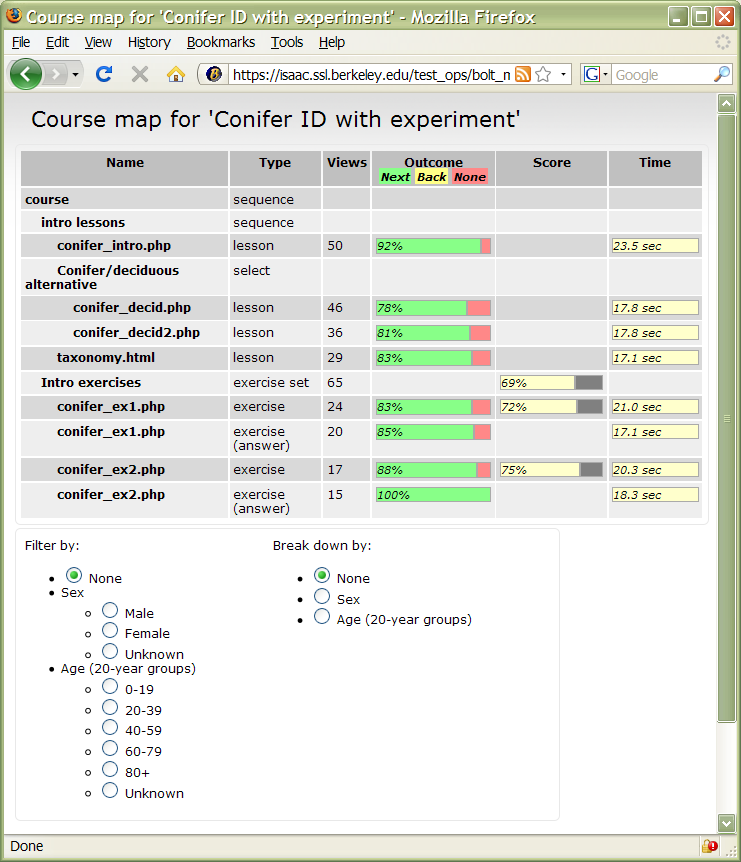
Course maps
Attachments (3)
- compare2.png (68.3 KB) - added by 17 years ago.
- compare.png (72.5 KB) - added by 17 years ago.
- map.png (89.7 KB) - added by 17 years ago.
Download all attachments as: .zip